In short: the best-known job-by-job tables come from US Army testing in World War II. In those tables, accountants, lawyers, engineers, teachers and chemists had the highest average scores, and farm workers, miners and lumberjacks the lowest. Modern Swedish data show the same broad pattern, with doctors scoring highest. But the spread inside every job is huge. In a 1944 Army sample, the top tenth of labourers outscored the bottom tenth of accountants. An average tells you about a group, not about what any one person can do.
IQ by profession: the short answer
People have been measuring the test scores of different occupations for more than a century, and the ranking that comes out is remarkably stable. Jobs built around words, numbers and abstract problems sit near the top. Jobs centred on physical work, or learned mostly by doing, sit lower. That much is not controversial.
What often gets lost is how loosely people are sorted. Lists online tend to give a single "IQ" for each job, often with no source. The real tables give a middle value and a wide spread, and they come from particular groups of people, tested on particular tests, at particular times. Read that way, the data say three things:
- There is an order. Professional and clerical jobs had the highest middle scores in the 1940s Army data, and doctors top the modern Swedish data.
- The overlap is enormous. Almost every job contained people scoring well above and well below the overall average.
- The order is not a set of entry requirements. No job in these studies required a particular score, and the researchers themselves warned against reading the tables that way.
Average IQ by occupation: the data
The table below brings together the two largest published job-by-job tables we could check against the original documents. Both come from the Army General Classification Test (AGCT), the screening test given to US Army recruits in World War II. You can search it, sort it, and switch between the two datasets.
| Rank | Occupation (as published) | N | 10th | 25th | Median | 75th | 90th | Median, IQ scale ≈ |
|---|---|---|---|---|---|---|---|---|
| 1 | Accountant | 216 | 114 | 121 | 129 | 136 | 143 | 122 |
| 2 | Student, Mechanical Engineering | 62 | 114 | 122 | 128 | 135 | 140 | 121 |
| 3 | Personnel Clerk | 33 | – | – | 128 | – | – | 121 |
| 4 | Student, Medicine | 124 | 116 | 120 | 127 | 135 | 140 | 120 |
| 5 | Chemist | 40 | – | – | 127 | – | – | 120 |
| 6 | Student, Electrical Engineering | 36 | – | – | 127 | – | – | 120 |
| 7 | Writer | 54 | 114 | 123 | 126 | 133 | 140 | 120 |
| 8 | Student, Civil Engineering | 39 | – | – | 126 | – | – | 120 |
| 9 | Statistical Clerk | 72 | 114 | 119 | 125 | 133 | 141 | 119 |
| 10 | Student, Chemical Engineering | 73 | 105 | 117 | 125 | 134 | 142 | 119 |
| 11 | Teacher | 360 | 110 | 117 | 124 | 132 | 140 | 118 |
| 12 | Lawyer | 164 | 112 | 118 | 124 | 132 | 141 | 118 |
| 13 | Student, Business or Public Administration | 152 | 114 | 118 | 124 | 131 | 140 | 118 |
| 14 | Auditor | 89 | 88 | 112 | 124 | 132 | 145 | 118 |
| 15 | Student, Dentistry | 31 | – | – | 124 | – | – | 118 |
| 16 | Bookkeeper, General | 302 | 108 | 114 | 122 | 129 | 138 | 117 |
| 17 | Chief Clerk | 297 | 107 | 114 | 122 | 131 | 141 | 117 |
| 18 | Stenographer (Shorthand typist) | 206 | 109 | 115 | 122 | 130 | 139 | 117 |
| 19 | Pharmacist | 78 | 103 | 112 | 121 | 129 | 135 | 116 |
| 20 | Typist | 75 | 102 | 112 | 121 | 128 | 139 | 116 |
| 21 | Draftsman (Draughtsperson) | 139 | 99 | 109 | 120 | 127 | 137 | 115 |
| 22 | Chemical Laboratory Assistant | 134 | 97 | 109 | 120 | 127 | 138 | 115 |
| 23 | Draftsman, Mechanical (Mechanical draughtsperson) | 99 | 105 | 111 | 120 | 128 | 135 | 115 |
| 24 | Investigator | 72 | 99 | 114 | 120 | 124 | 132 | 115 |
| 25 | Reporter | 70 | 104 | 113 | 120 | 128 | 136 | 115 |
| 26 | Tool Designer | 29 | – | – | 120 | – | – | 115 |
| 27 | Tabulating Machine Operator (Punched-card (tabulating) machine operator) | 61 | 102 | 111 | 120 | 127 | 134 | 115 |
| 28 | Addressing-Embossing Machine Operator | 78 | 99 | 109 | 119 | 127 | 132 | 114 |
| 29 | Traffic Rate Clerk | 42 | – | – | 119 | – | – | 114 |
| 30 | Clerk-Typist | 616 | 101 | 110 | 119 | 126 | 134 | 114 |
| 31 | Postal Clerk | 377 | 100 | 109 | 119 | 126 | 136 | 114 |
| 32 | Bookkeeping Machine Operator | 56 | 97 | 108 | 118 | 128 | 140 | 114 |
| 33 | Meat or Dairy Inspector | 37 | – | – | 118 | – | – | 114 |
| 34 | Photographic Laboratory Technician | 36 | – | – | 118 | – | – | 114 |
| 35 | Teletype Operator | 29 | – | – | 118 | – | – | 114 |
| 36 | Student, Sociology | 28 | – | – | 118 | – | – | 114 |
| 37 | Switchboard Installer, Telephone and Telegraph, Dial | 34 | – | – | 117 | – | – | 113 |
| 38 | Cashier | 168 | 91 | 107 | 117 | 127 | 134 | 113 |
| 39 | Stock Record Clerk | 114 | 91 | 107 | 117 | 125 | 131 | 113 |
| 40 | Clerk, General | 2,063 | 97 | 108 | 117 | 125 | 133 | 113 |
| 41 | Radio Repairman | 198 | 97 | 108 | 117 | 125 | 136 | 113 |
| 42 | Purchasing Agent | 197 | 88 | 104 | 117 | 125 | 134 | 113 |
| 43 | Survey and Instrument Man | 51 | 91 | 102 | 117 | 123 | 130 | 113 |
| 44 | Physics Laboratory Assistant | 26 | – | – | 117 | – | – | 113 |
| 45 | Stock Control Clerk | 152 | 95 | 107 | 117 | 124 | 133 | 113 |
| 46 | Manager, Production | 94 | 99 | 111 | 117 | 124 | 129 | 113 |
| 47 | Boilermaker, Layer-Out | 88 | 76 | 99 | 116 | 125 | 137 | 112 |
| 48 | Radio Operator | 31 | – | – | 116 | – | – | 112 |
| 49 | Linotype Operator | 43 | – | – | 116 | – | – | 112 |
| 50 | Student, Mechanics | 66 | 93 | 105 | 115 | 122 | 128 | 111 |
| 51 | Salesman | 859 | 94 | 107 | 115 | 125 | 133 | 111 |
| 52 | Athletic Instructor | 73 | 93 | 104 | 115 | 125 | 133 | 111 |
| 53 | Store Manager | 385 | 91 | 104 | 115 | 124 | 133 | 111 |
| 54 | Installer-Repairman, Telephone and Telegraph | 62 | 98 | 108 | 115 | 120 | 133 | 111 |
| 55 | Motorcycle Mechanic | 46 | – | – | 115 | – | – | 111 |
| 56 | Dispatcher Clerk, Crew | 25 | – | – | 115 | – | – | 111 |
| 57 | Tool Dresser | 49 | – | – | 115 | – | – | 111 |
| 58 | File Clerk | 119 | 96 | 105 | 114 | 123 | 129 | 111 |
| 59 | Embalmer | 55 | 98 | 105 | 114 | 119 | 130 | 111 |
| 60 | Brake Inspector, Railway | 130 | 90 | 102 | 114 | 127 | 133 | 111 |
| 61 | Airplane and Engine Mechanic | 115 | 92 | 102 | 114 | 123 | 130 | 111 |
| 62 | Shop Clerk | 89 | 93 | 104 | 114 | 124 | 133 | 111 |
| 63 | Artist | 82 | 96 | 106 | 114 | 121 | 127 | 111 |
| 64 | Band Leader | 82 | 92 | 99 | 114 | 124 | 129 | 111 |
| 65 | Photographer | 70 | 88 | 109 | 114 | 124 | 129 | 111 |
| 66 | Geologist | 62 | 93 | 105 | 114 | 124 | 131 | 111 |
| 67 | Airplane Engine Service Mechanic | 52 | 99 | 105 | 114 | 119 | 131 | 111 |
| 68 | Cable Splicer, Telephone and Telegraph | 43 | – | – | 114 | – | – | 111 |
| 69 | Surveyor | 42 | – | – | 114 | – | – | 111 |
| 70 | Student, High School, Academic | 2,608 | 92 | 102 | 113 | 122 | 129 | 110 |
| 71 | Blueprinter or Photostat Operator | 67 | 91 | 100 | 113 | 125 | 134 | 110 |
| 72 | Carpenter, Heavy Construction | 82 | 87 | 97 | 112 | 124 | 132 | 109 |
| 73 | Dispatcher, Motor Vehicle | 71 | 82 | 93 | 112 | 124 | 131 | 109 |
| 74 | Gunsmith | 53 | 88 | 100 | 112 | 119 | 123 | 109 |
| 75 | Musician, Instrumental | 161 | 90 | 103 | 112 | 120 | 129 | 109 |
| 76 | Tool Maker | 147 | 92 | 101 | 112 | 123 | 129 | 109 |
| 77 | Nurse, Practical | 35 | – | – | 112 | – | – | 109 |
| 78 | Photographer, Portrait | 28 | – | – | 112 | – | – | 109 |
| 79 | Photolithographer | 26 | – | – | 112 | – | – | 109 |
| 80 | Rodman and Chainman, Surveying | 117 | 87 | 97 | 111 | 120 | 127 | 108 |
| 81 | Airplane Fabric and Dope Worker | 43 | – | – | 111 | – | – | 108 |
| 82 | Multilith or Multigraph Operator | 54 | 98 | 105 | 111 | 120 | 130 | 108 |
| 83 | Shipping Clerk | 408 | 89 | 101 | 111 | 121 | 128 | 108 |
| 84 | Printer | 192 | 89 | 99 | 111 | 120 | 129 | 108 |
| 85 | Steward | 68 | 73 | 95 | 111 | 119 | 125 | 108 |
| 86 | Foreman, Warehouse | 138 | 80 | 101 | 111 | 121 | 129 | 108 |
| 87 | Bandsman, Cornet or Trumpet | 33 | – | – | 111 | – | – | 108 |
| 88 | Instrument Repairman, Nonelectrical | 37 | – | – | 111 | – | – | 108 |
| 89 | Boring Mill Operator | 150 | 86 | 98 | 111 | 120 | 129 | 108 |
| 90 | Projectionist, Motion Picture | 111 | 87 | 100 | 110 | 122 | 129 | 108 |
| 91 | Dental Laboratory Technician | 69 | 79 | 94 | 110 | 121 | 127 | 108 |
| 92 | Laboratory Technician, V-mail or Microfilm | 52 | 81 | 100 | 110 | 119 | 129 | 108 |
| 93 | Foreman, Machine Shop | 48 | – | – | 110 | – | – | 108 |
| 94 | Stock Clerk | 791 | 85 | 99 | 110 | 120 | 127 | 108 |
| 95 | Painter, Sign | 96 | 83 | 98 | 110 | 117 | 126 | 108 |
| 96 | Machinist | 617 | 86 | 99 | 110 | 120 | 127 | 108 |
| 97 | Photographer, Aerial | 603 | 83 | 98 | 110 | 119 | 128 | 108 |
| 98 | Engine Lathe Operator | 283 | 89 | 101 | 110 | 120 | 128 | 108 |
| 99 | Parts Clerk, Automotive | 133 | 90 | 98 | 110 | 119 | 127 | 108 |
| 100 | Cook's Helper | 62 | 78 | 89 | 110 | 122 | 132 | 108 |
| 101 | Railway Mechanic, General | 61 | 88 | 98 | 110 | 119 | 131 | 108 |
| 102 | Office Machine Serviceman | 51 | 89 | 99 | 110 | 119 | 128 | 108 |
| 103 | Student, High School, Commercial | 275 | 90 | 99 | 110 | 118 | 124 | 108 |
| 104 | Electrician, Airplane | 35 | – | – | 110 | – | – | 108 |
| 105 | Student, Manual Arts | 60 | 87 | 99 | 109 | 121 | 132 | 107 |
| 106 | Policeman | 172 | 86 | 96 | 109 | 118 | 128 | 107 |
| 107 | Sales Clerk | 2,362 | 82 | 95 | 109 | 119 | 128 | 107 |
| 108 | Electrician | 435 | 83 | 96 | 109 | 118 | 124 | 107 |
| 109 | Lineman, Telephone and Telegraph | 96 | 79 | 97 | 109 | 120 | 129 | 107 |
| 110 | Watch Repairman | 51 | 93 | 103 | 109 | 119 | 123 | 107 |
| 111 | Receiving or Shipping Checker | 900 | 88 | 99 | 109 | 119 | 127 | 107 |
| 112 | Car Mechanic, Railway | 158 | 89 | 98 | 109 | 119 | 129 | 107 |
| 113 | Toolroom Keeper | 70 | 78 | 99 | 109 | 118 | 121 | 107 |
| 114 | Refrigeration Mechanic | 58 | 86 | 97 | 109 | 120 | 126 | 107 |
| 115 | Cameraman, Motion Picture | 29 | – | – | 109 | – | – | 107 |
| 116 | Telephone Operator | 34 | – | – | 109 | – | – | 107 |
| 117 | Hatch Tender | 31 | – | – | 109 | – | – | 107 |
| 118 | Not Elsewhere Classified | 14,299 | 76 | 92 | 108 | 120 | 129 | 106 |
| 119 | Machinist's Helper | 429 | 85 | 96 | 108 | 118 | 125 | 106 |
| 120 | Foreman, Labor | 238 | 77 | 93 | 108 | 120 | 129 | 106 |
| 121 | Locomotive Fireman | 106 | 75 | 97 | 108 | 118 | 126 | 106 |
| 122 | Entertainer | 54 | 78 | 90 | 108 | 120 | 125 | 106 |
| 123 | Meat Cutter | 691 | 80 | 94 | 108 | 117 | 126 | 106 |
| 124 | Student, High School, Vocational | 504 | 85 | 96 | 108 | 115 | 124 | 106 |
| 125 | Cabinetmaker | 114 | 80 | 92 | 108 | 119 | 130 | 106 |
| 126 | Airplane Engine Mechanic | 79 | 80 | 94 | 108 | 120 | 129 | 106 |
| 127 | Heat Treater | 73 | 79 | 96 | 108 | 118 | 125 | 106 |
| 128 | Fire Fighter | 70 | 82 | 93 | 108 | 117 | 123 | 106 |
| 129 | Engineering Aide | 69 | 87 | 96 | 108 | 119 | 124 | 106 |
| 130 | Construction Equipment Mechanic | 53 | 81 | 93 | 108 | 116 | 126 | 106 |
| 131 | Optician | 45 | – | – | 108 | – | – | 106 |
| 132 | Packer, High Explosives | 29 | – | – | 108 | – | – | 106 |
| 133 | Petroleum Storage Technician | 29 | – | – | 108 | – | – | 106 |
| 134 | Pattern Maker, Wood | 25 | – | – | 108 | – | – | 106 |
| 135 | Electrician, Automotive | 57 | 88 | 100 | 108 | 115 | 127 | 106 |
| 136 | Coppersmith | 43 | – | – | 108 | – | – | 106 |
| 137 | Ship Fitter | 66 | 87 | 99 | 107 | 120 | 128 | 105 |
| 138 | Sheet Metal Worker | 462 | 82 | 95 | 107 | 117 | 126 | 105 |
| 139 | Electroplater | 84 | 76 | 90 | 107 | 113 | 120 | 105 |
| 140 | Instrument Repairman, Electrical | 50 | 81 | 100 | 107 | 120 | 131 | 105 |
| 141 | Steam Fitter | 47 | – | – | 107 | – | – | 105 |
| 142 | Diesel Mechanic | 42 | – | – | 107 | – | – | 105 |
| 143 | Carpenter, Ship | 34 | – | – | 107 | – | – | 105 |
| 144 | Bandsman, Snare Drum | 28 | – | – | 107 | – | – | 105 |
| 145 | Lithographic Pressman | 26 | – | – | 107 | – | – | 105 |
| 146 | Electric Motor Repairman | 76 | 88 | 96 | 106 | 117 | 125 | 105 |
| 147 | Shop Maintenance Mechanic | 280 | 82 | 92 | 106 | 117 | 124 | 105 |
| 148 | Job Pressman | 119 | 83 | 95 | 106 | 116 | 126 | 105 |
| 149 | Riveter, Pneumatic | 113 | 79 | 91 | 106 | 115 | 124 | 105 |
| 150 | Power Shovel Operator | 46 | – | – | 106 | – | – | 105 |
| 151 | Photographic Technician, Aerial | 39 | – | – | 106 | – | – | 105 |
| 152 | Brakeman, Railway | 182 | 80 | 93 | 105 | 116 | 125 | 104 |
| 153 | Automobile Body Repairman | 136 | 73 | 86 | 105 | 115 | 126 | 104 |
| 154 | Tire Rebuilder | 62 | 76 | 87 | 105 | 114 | 118 | 104 |
| 155 | Utility Repairman | 305 | 79 | 91 | 105 | 116 | 127 | 104 |
| 156 | Boilermaker | 158 | 81 | 94 | 105 | 115 | 123 | 104 |
| 157 | Foreman, Automotive Repair Shop | 39 | – | – | 105 | – | – | 104 |
| 158 | Salvage Man | 35 | – | – | 105 | – | – | 104 |
| 159 | Structural Steel Worker | 107 | 76 | 88 | 104 | 119 | 126 | 103 |
| 160 | Welder, Combination | 236 | 72 | 90 | 104 | 115 | 124 | 103 |
| 161 | Welder, Spot | 89 | 73 | 89 | 104 | 112 | 122 | 103 |
| 162 | Seaman | 65 | 69 | 84 | 104 | 114 | 120 | 103 |
| 163 | Engineman, Operating | 31 | – | – | 104 | – | – | 103 |
| 164 | Foreman, Construction | 281 | 72 | 88 | 104 | 118 | 128 | 103 |
| 165 | Millwright | 71 | 81 | 90 | 104 | 118 | 125 | 103 |
| 166 | Welder, Electric Arc | 482 | 78 | 90 | 103 | 114 | 122 | 102 |
| 167 | Plumber | 222 | 71 | 87 | 103 | 114 | 123 | 102 |
| 168 | Switchman, Railway | 52 | 83 | 89 | 103 | 112 | 122 | 102 |
| 169 | Machine Operator, Designated Machine | 3,044 | 77 | 89 | 103 | 114 | 123 | 102 |
| 170 | Hammersmith | 45 | – | – | 103 | – | – | 102 |
| 171 | Student, High School, Agricultural | 89 | 82 | 92 | 102 | 114 | 121 | 102 |
| 172 | Automotive Mechanic | 1,693 | 75 | 89 | 102 | 114 | 122 | 102 |
| 173 | Blacksmith | 162 | 75 | 88 | 102 | 113 | 122 | 102 |
| 174 | Welder, Acetylene | 101 | 77 | 91 | 102 | 114 | 120 | 102 |
| 175 | Bricklayer | 213 | 77 | 88 | 102 | 114 | 122 | 102 |
| 176 | Blaster or Powderman | 75 | 73 | 85 | 102 | 115 | 121 | 102 |
| 177 | Small Craft Operator | 40 | – | – | 102 | – | – | 102 |
| 178 | Lineman, Power | 80 | 73 | 86 | 101 | 111 | 120 | 101 |
| 179 | Packing Case Maker | 66 | 73 | 87 | 101 | 117 | 125 | 101 |
| 180 | Carpenter, General | 1,004 | 73 | 86 | 101 | 113 | 123 | 101 |
| 181 | Pipe Fitter | 194 | 76 | 86 | 101 | 112 | 121 | 101 |
| 182 | Electric Truck Driver | 87 | 64 | 87 | 101 | 112 | 121 | 101 |
| 183 | Highway Maintenance Man | 44 | – | – | 101 | – | – | 101 |
| 184 | Automobile Serviceman | 1,179 | 73 | 87 | 101 | 114 | 123 | 101 |
| 185 | Rigger | 44 | – | – | 101 | – | – | 101 |
| 186 | Woodworking-Machine Operator | 206 | 73 | 85 | 100 | 112 | 120 | 100 |
| 187 | Chauffeur (Private driver) | 358 | 74 | 87 | 100 | 113 | 122 | 100 |
| 188 | Motorcyclist | 32 | – | – | 100 | – | – | 100 |
| 189 | Burner, Acetylene | 113 | 75 | 88 | 100 | 110 | 121 | 100 |
| 190 | Tractor Driver | 968 | 69 | 82 | 99 | 110 | 120 | 99 |
| 191 | Painter, General | 680 | 70 | 83 | 99 | 113 | 121 | 99 |
| 192 | Foundryman | 149 | 67 | 83 | 99 | 113 | 121 | 99 |
| 193 | Animation Artist | 140 | 74 | 85 | 99 | 112 | 123 | 99 |
| 194 | Hospital Orderly | 122 | 72 | 86 | 99 | 110 | 121 | 99 |
| 195 | Baker | 334 | 69 | 83 | 99 | 113 | 123 | 99 |
| 196 | Packer, Supplies | 206 | 67 | 81 | 99 | 112 | 122 | 99 |
| 197 | Sewing Machine Operator | 91 | 71 | 80 | 98 | 112 | 120 | 99 |
| 198 | Truck Driver, Heavy | 3,473 | 71 | 83 | 98 | 111 | 120 | 99 |
| 199 | Painter, Automobile | 72 | 72 | 83 | 98 | 108 | 123 | 99 |
| 200 | Hoist Operator | 117 | 73 | 83 | 98 | 109 | 119 | 99 |
| 201 | Construction Machine Operator | 145 | 70 | 79 | 97 | 107 | 117 | 98 |
| 202 | Horsebreaker (Horse trainer) | 91 | 73 | 85 | 97 | 108 | 119 | 98 |
| 203 | Tailor | 74 | 69 | 82 | 97 | 112 | 120 | 98 |
| 204 | Stonemason | 43 | – | – | 97 | – | – | 98 |
| 205 | Crane Operator | 128 | 72 | 87 | 96 | 111 | 120 | 97 |
| 206 | Upholsterer | 98 | 74 | 88 | 96 | 111 | 121 | 97 |
| 207 | Cook | 653 | 67 | 79 | 96 | 111 | 120 | 97 |
| 208 | Concrete-Mixer Operator | 56 | 65 | 80 | 96 | 109 | 119 | 97 |
| 209 | Truck Driver, Light | 3,966 | 69 | 80 | 95 | 109 | 119 | 96 |
| 210 | Stationary Fireman | 107 | 67 | 80 | 95 | 109 | 124 | 96 |
| 211 | Warehouseman | 90 | 70 | 87 | 95 | 110 | 120 | 96 |
| 212 | Gas and Oil Man | 61 | 75 | 85 | 95 | 111 | 124 | 96 |
| 213 | Forging-Press Operator | 43 | – | – | 95 | – | – | 96 |
| 214 | Longshoreman | 53 | 61 | 77 | 95 | 109 | 116 | 96 |
| 215 | Well Driller | 62 | 71 | 82 | 95 | 114 | 122 | 96 |
| 216 | Marine Fireman | 27 | – | – | 94 | – | – | 96 |
| 217 | Laundry Machine Operator | 121 | 71 | 82 | 93 | 111 | 121 | 95 |
| 218 | Laborer | 7,805 | 65 | 76 | 93 | 108 | 119 | 95 |
| 219 | Barber | 166 | 66 | 79 | 93 | 109 | 120 | 95 |
| 220 | Shoe Repairman | 118 | 68 | 77 | 93 | 109 | 118 | 95 |
| 221 | Jackhammer Operator | 55 | 61 | 77 | 93 | 109 | 118 | 95 |
| 222 | Groundman, Telephone, Telegraph, or Power | 32 | – | – | 91 | – | – | 93 |
| 223 | Section Hand, Railway | 337 | 64 | 74 | 90 | 104 | 115 | 93 |
| 224 | Teamster | 284 | 64 | 74 | 87 | 104 | 114 | 90 |
| 225 | Miner | 502 | 67 | 75 | 87 | 103 | 114 | 90 |
| 226 | Farm Worker | 7,475 | 61 | 70 | 86 | 103 | 115 | 90 |
| 227 | Lumberjack | 236 | 60 | 70 | 85 | 100 | 116 | 89 |
| Occupation (as published) | N | Mean | Median | SD | Lowest | Highest | Mean, IQ scale ≈ |
|---|---|---|---|---|---|---|---|
| Accountant | 172 | 128.1 | 128.1 | 11.7 | 94 | 157 | 121 |
| Lawyer | 94 | 127.6 | 126.8 | 10.9 | 96 | 157 | 121 |
| Engineer | 39 | 126.6 | 125.8 | 11.7 | 100 | 151 | 120 |
| Public Relations Man (Public relations officer) | 42 | 126 | 125.5 | 11.4 | 100 | 149 | 120 |
| Auditor | 62 | 125.9 | 125.5 | 11.2 | 98 | 151 | 119 |
| Chemist | 21 | 124.8 | 124.5 | 13.8 | 102 | 153 | 119 |
| Reporter | 45 | 124.5 | 125.7 | 11.7 | 100 | 157 | 118 |
| Chief Clerk | 165 | 124.2 | 124.5 | 11.7 | 88 | 153 | 118 |
| Teacher | 256 | 122.8 | 123.7 | 12.8 | 76 | 155 | 117 |
| Draftsman (Draughtsperson) | 153 | 122 | 121.7 | 12.8 | 74 | 155 | 117 |
| Stenographer (Shorthand typist) | 147 | 121 | 121.4 | 12.5 | 66 | 151 | 116 |
| Pharmacist | 58 | 120.5 | 124 | 15.2 | 76 | 149 | 115 |
| Tabulating Machine Operator (Punched-card (tabulating) machine operator) | 140 | 120.1 | 119.8 | 13.3 | 80 | 151 | 115 |
| Bookkeeper | 272 | 120 | 119.7 | 13.1 | 70 | 157 | 115 |
| Manager, Sales | 42 | 119 | 120.7 | 11.5 | 90 | 137 | 114 |
| Purchasing Agent | 98 | 118.7 | 119.2 | 12.9 | 82 | 153 | 114 |
| Manager, Production | 34 | 118.1 | 117 | 16 | 82 | 153 | 114 |
| Photographer | 95 | 117.6 | 119.8 | 13.9 | 66 | 147 | 113 |
| Clerk, General | 496 | 117.5 | 117.9 | 13 | 68 | 155 | 113 |
| Clerk-Typist | 468 | 116.8 | 117.3 | 12 | 80 | 147 | 113 |
| Manager, Miscellaneous | 235 | 116 | 117.5 | 14.8 | 60 | 151 | 112 |
| Installer-Repairman, Tel & Tel (Telephone and telegraph installer-repairer) | 96 | 115.8 | 116.8 | 13.1 | 76 | 149 | 112 |
| Cashier | 111 | 115.8 | 116.8 | 11.9 | 80 | 145 | 112 |
| Instrument Repairman | 47 | 115.5 | 115.8 | 11.9 | 82 | 141 | 112 |
| Radio Repairman | 267 | 115.3 | 116.5 | 14.5 | 56 | 151 | 111 |
| Printer, Job Pressman, Lithographic Pressman | 132 | 115.1 | 116.7 | 14.3 | 60 | 149 | 111 |
| Salesman | 494 | 115.1 | 116.2 | 15.7 | 60 | 153 | 111 |
| Artist | 48 | 114.9 | 115.4 | 11.2 | 82 | 139 | 111 |
| Manager, Retail Store | 420 | 114 | 116.2 | 15.7 | 52 | 151 | 111 |
| Laboratory Assistant | 128 | 113.4 | 114 | 14.6 | 76 | 147 | 110 |
| Tool Maker | 60 | 112.5 | 111.6 | 12.5 | 76 | 143 | 109 |
| Inspector | 358 | 112.3 | 113.1 | 15.7 | 54 | 147 | 109 |
| Stock Clerk | 490 | 111.8 | 113 | 16.3 | 54 | 151 | 109 |
| Receiving and Shipping Clerk | 486 | 111.3 | 113.4 | 16.4 | 58 | 155 | 108 |
| Musician | 157 | 110.9 | 112.8 | 15.9 | 56 | 147 | 108 |
| Machinist | 456 | 110.1 | 110.8 | 16.1 | 38 | 153 | 108 |
| Foreman | 298 | 109.8 | 111.4 | 16.7 | 60 | 151 | 107 |
| Watchmaker | 56 | 109.8 | 113 | 14.7 | 68 | 147 | 107 |
| Airplane Mechanic | 235 | 109.3 | 110.5 | 14.9 | 66 | 147 | 107 |
| Sales Clerk | 492 | 109.2 | 110.4 | 16.3 | 42 | 149 | 107 |
| Electrician | 289 | 109 | 110.6 | 15.2 | 64 | 149 | 107 |
| Lathe Operator | 172 | 108.5 | 109.4 | 15.5 | 64 | 147 | 106 |
| Receiving & Shipping Checker | 281 | 107.6 | 108.9 | 15.8 | 52 | 151 | 106 |
| Sheet Metal Worker | 498 | 107.5 | 108.1 | 15.3 | 62 | 153 | 106 |
| Lineman, Power and Tel & Tel (Power and telephone line worker) | 77 | 107.1 | 108.8 | 15.5 | 70 | 133 | 105 |
| Assembler | 498 | 106.3 | 106.6 | 14.6 | 48 | 145 | 105 |
| Mechanic | 421 | 106.3 | 108.3 | 16 | 60 | 155 | 105 |
| Machine Operator | 486 | 104.8 | 105.7 | 17.1 | 42 | 151 | 104 |
| Auto Serviceman | 539 | 104.2 | 105.9 | 16.7 | 30 | 141 | 103 |
| Riveter | 239 | 104.1 | 105.3 | 15.1 | 50 | 141 | 103 |
| Cabinetmaker | 48 | 103.5 | 104.7 | 15.9 | 66 | 127 | 103 |
| Upholsterer | 59 | 103.3 | 105.8 | 14.5 | 68 | 131 | 102 |
| Butcher | 259 | 102.9 | 104.8 | 17.1 | 42 | 147 | 102 |
| Plumber | 128 | 102.7 | 104.8 | 16 | 56 | 139 | 102 |
| Bartender | 98 | 102.2 | 105 | 16.6 | 56 | 137 | 102 |
| Carpenter, Construction | 451 | 102.1 | 104.1 | 19.5 | 42 | 147 | 102 |
| Pipe Fitter | 72 | 101.9 | 105.2 | 18 | 56 | 139 | 101 |
| Welder | 493 | 101.8 | 103.6 | 16.1 | 48 | 147 | 101 |
| Auto Mechanic | 466 | 101.3 | 101.8 | 17 | 48 | 151 | 101 |
| Molder | 79 | 101.1 | 105.5 | 20.2 | 48 | 137 | 101 |
| Chauffeur (Private driver) | 194 | 100.8 | 103 | 18.4 | 46 | 143 | 101 |
| Tractor Driver | 354 | 99.5 | 101.6 | 19.1 | 42 | 147 | 100 |
| Painter, General | 440 | 98.3 | 100.1 | 18.7 | 38 | 147 | 99 |
| Crane Hoist Operator | 99 | 97.9 | 99.1 | 16.6 | 58 | 147 | 98 |
| Cook and Baker | 436 | 97.2 | 99.5 | 20.8 | 20 | 147 | 98 |
| Weaver | 56 | 97 | 97.3 | 17.7 | 50 | 135 | 98 |
| Truck Driver | 817 | 96.2 | 97.8 | 19.7 | 16 | 149 | 97 |
| Laborer | 856 | 95.8 | 97.7 | 20.1 | 26 | 145 | 97 |
| Barber | 103 | 95.3 | 98.1 | 20.5 | 42 | 141 | 96 |
| Lumberjack | 59 | 94.7 | 96.5 | 19.8 | 46 | 137 | 96 |
| Farmer | 700 | 92.7 | 93.4 | 21.8 | 24 | 147 | 95 |
| Farmhand (Farm worker) | 817 | 91.4 | 94 | 20.7 | 24 | 141 | 94 |
| Miner | 156 | 90.6 | 92 | 20.1 | 42 | 139 | 93 |
| Teamster | 77 | 87.7 | 89 | 19.6 | 46 | 145 | 91 |
AGCT standard scores of white enlisted men in the US Army, World War II, exactly as published (Stewart 1947, Table I; Harrell and Harrell 1945, Table 1). A dash means the source gives no value; Stewart printed percentiles only for groups of 50 or more. "IQ scale ≈" is our conversion, 100 + 0.75 × (AGCT − 100), rounded.
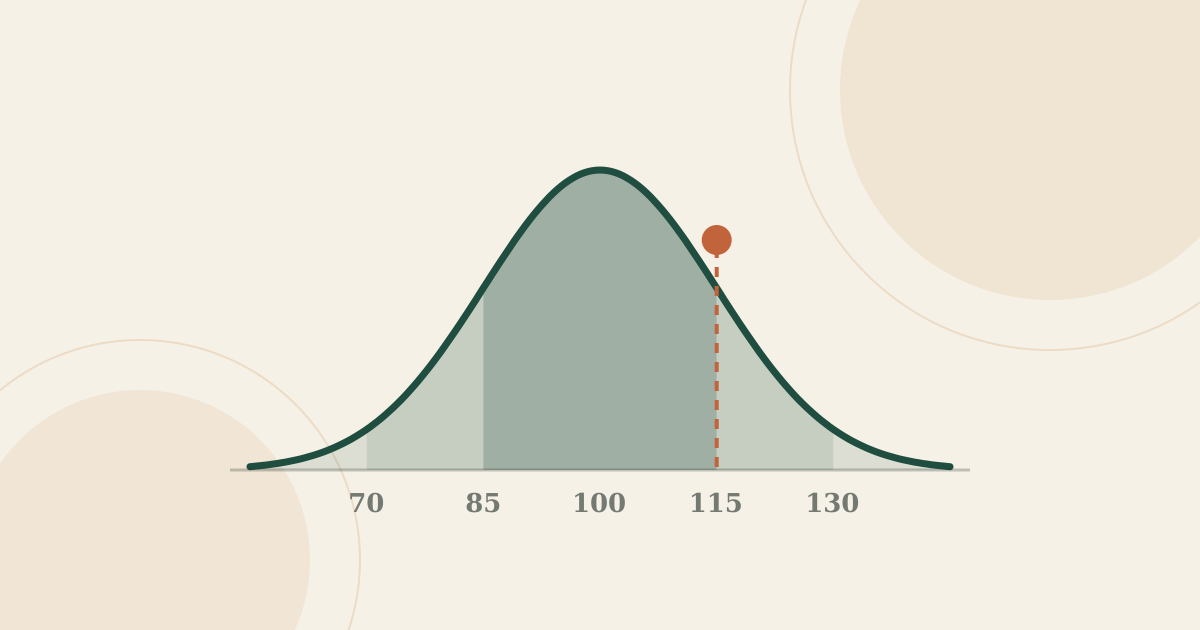
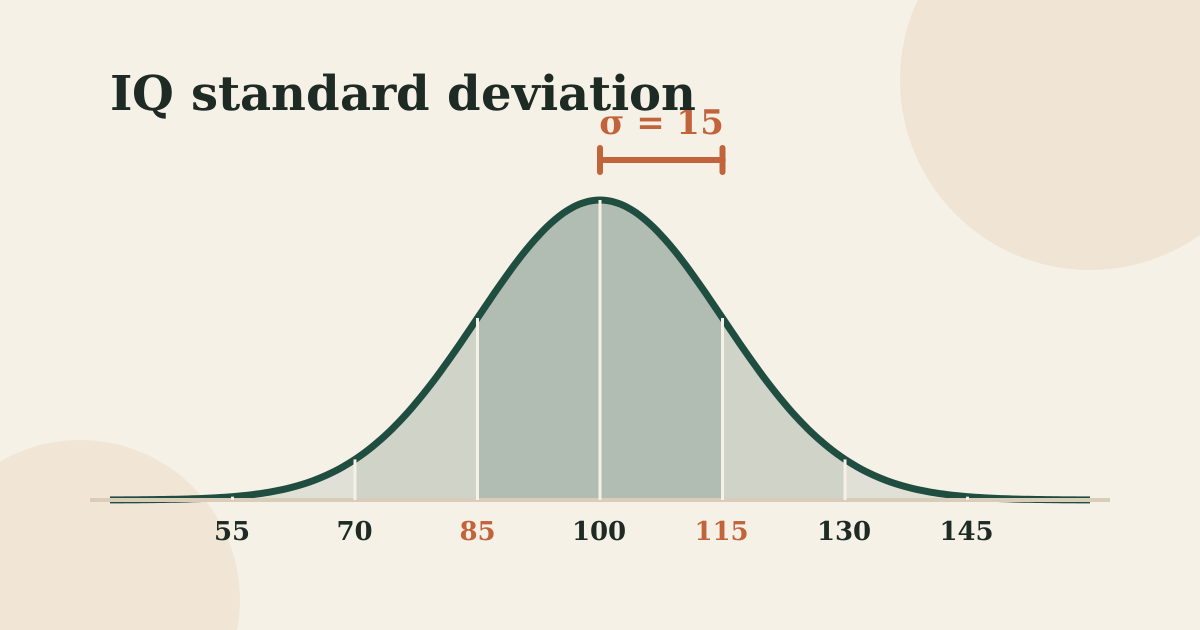
How to read it. The scores are AGCT standard scores, not IQ scores. The Army scale was built so that its standardisation group averaged 100, with a standard deviation of 20 points, according to Naomi Stewart's 1947 report. Modern IQ scales use a standard deviation of 15, so the same number does not mean the same thing on both. A few more points help:
- Harrell and Harrell (1945) give the mean, median, standard deviation and the lowest and highest score for 74 occupations, based on 18,782 men. Accountants had the highest mean (128.1) and teamsters, a job listed separately from truck drivers, the lowest (87.7).
- Stewart (1947) gives five percentile points (10th, 25th, 50th, 75th and 90th) for 227 occupations, based on 81,553 men. For groups of 25 to 49 people she published only the median, so some rows have one number.
- Job titles are as printed. Some describe 1940s work that has changed or vanished, such as tabulating machine operator or teamster. Where a modern name is obvious, we show it alongside.
- Small groups are noisy. Harrell and Harrell's chemists numbered just 21. Treat a difference of a few points between neighbouring jobs as meaningless.
- The "IQ scale" column is a conversion, not a measurement. Because the AGCT spreads scores over a standard deviation of 20 rather than 15, we also show each figure rescaled to the IQ scale: 100 + 0.75 × (AGCT score − 100). That keeps a score's distance from the average in standard deviations, but the comparison group is still 1940s Army recruits, not today's population, so read it as a rough guide.
Why the ranges matter more than the averages
The chart below shows how far the scores in each occupation spread out. The bar for each job runs from its 10th to its 90th percentile in Stewart's data, so it covers the middle 80% of the men in that job.
AGCT standard scores, Stewart (1947), Table I. A selection of familiar jobs with all five percentiles published, in her order; the full list is in the table above.
Two things stand out. First, the bars are long. Among accountants, the middle 80% ran from 114 to 143 on the AGCT scale. Among labourers, one of the largest groups at 7,805 men, it ran from 65 to 119. Second, the bars overlap heavily. The 90th percentile for labourers (119) is higher than the 10th percentile for accountants (114), so the top tenth of one group outscored the bottom tenth of the other.
Harrell and Harrell found the same thing in their own sample. Their lowest-scoring group, teamsters, had "2% of its cases scoring as high as the mean of Accountant", the highest-scoring group. The full ranges are even wider: at least one truck driver in their table scored 149, close to the top accountant's 157.
The spread is not even, though. The lowest scores rise steeply as you move up the list, while the highest scores change much less. In Harrell and Harrell's table, the lowest score among accountants was 94, against 16 among truck drivers, yet the top scores were 157 and 149. Writing about the same data in 2002, the sociologist Robert Hauser noted that "average scores increase largely as the minimum score increases". In other words, the higher-ranked jobs had fewer people with low scores, not a monopoly on high ones.
Where the numbers come from
Every figure on this page comes from the original papers, read from scans of the printed pages. Here is who was tested, how, and what each source cannot tell you.
Harrell and Harrell (1945): 74 occupations
Thomas and Margaret Harrell reported the scores of 18,782 white enlisted men in the Army Air Forces Air Service Command, grouped by the job they held before the war. The table appeared in Educational and Psychological Measurement; we checked it against a scan of the 1945 issue. The authors were open about its limits. Many of the best professionals may have become officers rather than enlisted men, so "averages among the professional occupations are too low". The Air Forces also received fewer low scorers than other branches, so the lowest-scoring jobs probably look higher than they should. The published figures cover white enlisted men only, which further narrows who they describe.
Stewart (1947): 227 occupations
Naomi Stewart, working with the Army's Personnel Research Section, analysed a 2% sample of all Army personnel taken on 30 June 1944. After removing officers, who had no AGCT scores, and miscoded records, she reported 227 occupations held by 81,553 white enlisted men. She limited the study to that group because other groups were too small in most occupations. Her report ran to 37 pages of Occupations in October 1947. She cautioned that some groups "may still be contaminated by punching errors" in the Army's punched-card records.
Hauser (2002): the Wisconsin Longitudinal Study
Robert Hauser of the University of Wisconsin looked at a very different kind of sample: people who graduated from Wisconsin high schools in 1957, plus a random group of their brothers and sisters. Their Henmon-Nelson test scores, taken mostly in their junior year, were put on an IQ-style scale, then linked to the jobs they held in their first job, in the mid-1970s and in the early 1990s. His working paper plots percentiles for 62 to 65 occupation groups, but only as bars without printed numbers, so we have not turned them into a table. What he does print is telling. The correlation between occupation and test score was "no more than moderate", at 0.39 to 0.44. Among men's first jobs, average scores by occupation group ran from 92.4 to 118.7, and the spread within a typical group was almost as large as the spread in the whole sample.
Wonderlic data
Many online lists quote median Wonderlic Personnel Test scores by job title. We could not obtain any Wonderlic manual or normative report to check those figures, so we do not use them. The psychologist Linda Gottfredson summarised the 1992 Wonderlic manual in her 1997 paper "Why g matters". Her own summary supports the point about spread: "the middle 50% of applicants to a job generally covers a range of 15 to 20 IQ points". Those were job applicants, not people already in post, tested by employers who chose to use the test.
What modern data shows
The Army tables are old, and the jobs and the people in them have changed. The best modern evidence comes from Sweden, where almost all young men once took a military enlistment test at about 18. Researchers can link those results to what the same men did decades later. The cognitive part of the test is scored on a 1 to 9 "stanine" scale, where 5 covers the middle 20% of test takers and 9 the top 4%.
- Doctors score highest. In Swedish data for 2011 analysed by Dal Bó and colleagues, medical doctors averaged 7.4 on the cognitive scale, against 5.1 for the population. Lawyers and judges averaged 6.8, academic economists 7.0 and political scientists 6.8.
- Engineers and lawyers are close behind. A separate study of about 1.3 million Swedish men by Adams, Keloharju and Knüpfer found average scores of 7.49 for physicians, 7.11 for engineers, 6.66 for lawyers and 6.32 for finance professionals, against 5.15 for the population.
- Bosses are bright, but not the brightest. In the same study, the median chief executive of a large company was above 83% of the population in cognitive ability, which also means 17% of men scored higher. Fewer than one in five large-company CEOs were in the top 5%. What set CEOs apart most was a combination of traits, including the non-cognitive rating from a psychologist's interview at enlistment.
- Politicians are above average. Swedish members of parliament averaged 6.4 on the cognitive scale and mayors 6.2, similar to the heads of mid-sized companies.
These studies cover men only, because only men were routinely tested, and one country. They report averages, not cut-offs. They also measure ability at 18, years before people chose and settled into their jobs.
| Group (Swedish men) | Average cognitive stanine (1 to 9) | Source |
|---|---|---|
| Physicians | 7.49 | Adams et al. 2018 |
| CEOs, >10 billion SEK | 7.16 | Adams et al. 2018 |
| Engineers | 7.11 | Adams et al. 2018 |
| CEOs, 1 to 10 billion SEK | 6.84 | Adams et al. 2018 |
| Lawyers | 6.66 | Adams et al. 2018 |
| CEOs, 100 million to 1 billion SEK | 6.6 | Adams et al. 2018 |
| Finance professionals | 6.32 | Adams et al. 2018 |
| CEOs, firm assets <100 million SEK | 6.02 | Adams et al. 2018 |
| Population | 5.15 | Adams et al. 2018 |
| Medical doctors | 7.4 | Dal Bó et al. 2017 |
| Economists (academic) | 7 | Dal Bó et al. 2017 |
| Lawyers and judges | 6.8 | Dal Bó et al. 2017 |
| Political scientists (academic) | 6.8 | Dal Bó et al. 2017 |
| CEOs (250+ employees) | 6.7 | Dal Bó et al. 2017 |
| Parliamentarians | 6.4 | Dal Bó et al. 2017 |
| Mayors | 6.2 | Dal Bó et al. 2017 |
| CEOs (25-249 employees) | 6.2 | Dal Bó et al. 2017 |
| Municipal councillors | 5.9 | Dal Bó et al. 2017 |
| CEOs (10-24 employees) | 5.8 | Dal Bó et al. 2017 |
| Nominated to municipal council | 5.5 | Dal Bó et al. 2017 |
| Population (men born 1951 to 1980) | 5.1 | Dal Bó et al. 2017 |
Stanines as published, not converted to IQ: 5 is the middle 20% of test takers and 9 the top 4%. Adams, Keloharju and Knüpfer (2018), Table 1; Dal Bó and others (2017), NBER Working Paper 23120, Tables 1 and 2.
Does IQ decide which job you can do?
Not in the way the tables are often read. Harrell and Harrell drew a cautious conclusion: "a certain minimum of intelligence is required for any one of many occupations", but someone "may have high intelligence and be found in a lowly occupation because he lacks other qualifications than intelligence". Stewart went further. She said the test could "by itself, furnish no positive guidance toward any one occupation", and that for counselling, where a person stands within the range of a job matters more than the bare score.
Hauser questioned even the idea of a hard floor. He pointed out that the AGCT was designed mainly to separate people at the lower end of ability, that very high scorers were often made officers, and that wartime Army demand for clerks may have pushed some clerical jobs up the list. The pattern is real, but its causes include education, training, family circumstances and the way people are selected into jobs, not only raw ability.
Today, entry to most professions is controlled by qualifications, licensing and experience rather than by an IQ score. Those things are linked to measured ability, but they also reflect effort, money, time and chance.
IQ and doing the job well
Getting into a job and doing it well are different questions. For years, the standard estimate for how well ability tests predict job performance was 0.51, from a 1998 review. A 2022 re-analysis cut that to 0.31, below structured interviews. We explain both figures, and what a correlation of that size means for one person, on our page about an IQ of 107 and job performance. Either way, skills, experience and fit with the work account for most of the difference between people.
IQ, pay and the top
Ability tests predict the status of a job better than they predict what it pays. A 2007 meta-analysis of long-term studies found intelligence correlated about 0.43 with occupational status but only about 0.20 with income; we cover it under what an IQ of 114 predicts. Swedish register data show average ability levelling off among the best-paid earners, as we describe for an IQ of 126. In a US study of more than 7,000 people, scores tracked income but not wealth, a story told under IQ 105. And one study of managers found colleagues rated leaders most highly at an IQ of about 120, explained on our IQ 118 page.
What a score of 120 means for careers
People searching for "jobs for an IQ of 120" usually want to know whether a score like that opens or closes doors. On modern IQ scales, 120 is higher than about 91% of people, as our IQ 120 page explains. Here is how it compares with the job data:
- Wisconsin: among men's first jobs, the highest average score for any occupation group in Hauser's data was 118.7, on a scale built to read like IQ. A score of 120 is above the average of every group.
- Sweden: a score above about 91% of people falls in stanine 8, the band Dal Bó and colleagues assign to the 7% of test takers just below the top 4%. No occupation in either Swedish table averaged as high as 8; doctors came closest at 7.4 and 7.49.
- Everywhere: every job in these studies included people well above and well below 120.
So an IQ of 120 is not a barrier to any job in these studies, and it does not point to any particular one. It suggests you are likely to find the reasoning side of demanding study and complex work manageable. Interest, training, persistence and opportunity decide far more about where you end up. Our guide to what counts as a good IQ score puts 120 in wider context.
What this means for you
Job-by-job IQ tables are interesting history and a fair picture of how groups differ on average. They are a poor guide to your own choices. A few points keep them in proportion:
- Look at the range, not the middle. In every occupation we could check, people scored across a wide band, and the bands overlapped.
- Check the source. A list that gives one IQ per job with no study, sample, year or test behind it is not data.
- Remember the age of the data. The classic tables describe men tested in the 1940s, using a test with its own scale, and the jobs have changed since.
- Weigh everything else. Skills, training, interest, health and opportunity matter at least as much as a test score.
If you are curious where your own reasoning sits, you can take our free IQ test and use the IQ percentile calculator to see what the result means. Our guide to what IQ measures explains what a score can and cannot tell you.
Frequently asked questions
What is the average IQ of a doctor?
No study gives doctors an IQ score as such. The best modern figure comes from Swedish military enlistment tests taken at about 18: in 2011 data, medical doctors averaged 7.4 on a 1 to 9 scale, against 5.1 for the population, the highest of any group compared. A second Swedish study found 7.49 for physicians. Both cover men only, and individual doctors vary widely.
What is the average IQ of a lawyer?
In a 1945 study of 18,782 US Army Air Forces enlisted men, 94 former lawyers had a mean Army General Classification Test score of 127.6, the second highest of 74 jobs. That test used a scale with a standard deviation of 20, not 15, so it is not an IQ. Their scores ranged from 96 to 157. Swedish data from 2011 put lawyers and judges at 6.8 on a 1 to 9 scale.
What is the average IQ of an engineer?
Only small or indirect figures exist. In the 1945 Army study by Harrell and Harrell, 39 former engineers had a mean Army test score of 126.6, on a scale where 20 points made one standard deviation. A Swedish study published in 2018 found engineers averaged 7.11 on the 1 to 9 enlistment scale, against 5.15 for all men. Neither figure is an IQ, and both hide a wide spread.
What is the average IQ of a teacher?
In the 1945 US Army study, 256 former teachers had a mean Army General Classification Test score of 122.8, with individual scores from 76 to 155. Stewart's 1947 analysis of 360 teachers found a median of 124, with the middle half between 117 and 132. These were men tested in wartime on the Army's own scale, so they are not IQ scores for today's teachers.
What is the average IQ of an accountant?
Accountants topped both large Army tables from the 1940s. Harrell and Harrell found a mean Army test score of 128.1 for 172 former accountants in 1945, and Stewart's 1947 report gave 216 accountants a median of 129. The Army scale had a standard deviation of 20, so these are not IQ scores. Even so, 10% of the accountants scored 114 or lower.
Which jobs have the highest average IQ?
In 1940s US Army data, accountants, lawyers, engineers, auditors, chemists, reporters and teachers had the highest average test scores. In modern Swedish data on men tested at 18, medical doctors score highest in both major studies, with engineers, academic economists and lawyers also well above average. Rankings depend on the sample and test, and the spread within each job is far larger than the gaps between neighbouring jobs.
Which careers fit an IQ of 120?
Almost any. An IQ of 120 is higher than about 91% of people. In Wisconsin data, it is above the average for every occupation group studied, and in Swedish data it is above the average for every profession, including doctors. That does not point you to a particular job. Interests, skills, training and opportunity matter much more than the score when choosing a career.
Do you need a high IQ to be a doctor?
No particular IQ is required. Entry to medicine depends on qualifications, exams and training. Doctors do score above average on reasoning tests: in Swedish data, they averaged 7.4 on a 1 to 9 scale, the highest group compared. But that is an average, and doctors' scores spread widely. Persistence, communication and judgement matter a great deal in medical training and practice.
Is IQ the best predictor of job success?
Probably not. A 1998 review put the link between ability tests and job performance at 0.51, but a 2022 re-analysis lowered it to 0.31, below structured interviews at 0.42. Ability helps, especially for learning complex work, yet experience, skills, effort and fit with the job explain most of the differences between people doing the same work.
Do people in the same job have similar IQs?
Not very. In a 1944 Army sample of 81,553 men, the middle 80% of accountants scored between 114 and 143, and of labourers between 65 and 119, so the groups overlapped heavily. A 1997 summary of Wonderlic applicant data found the middle half of applicants to a job usually spans 15 to 20 IQ points.
Sources
- Harrell, T. W. and Harrell, M. S. (1945). Army General Classification Test scores for civilian occupations. Educational and Psychological Measurement, 5(3), 229 to 239. Table 1, pp. 231 to 232. Scanned issue via Internet Archive.
- Stewart, N. (1947). A.G.C.T. scores of Army personnel grouped by occupation. Occupations: The Vocational Guidance Journal, 26(1), 5 to 41. Table I, pp. 9 to 17; AGCT scale, p. 6. Scanned issue via Internet Archive.
- War Department, Personnel Procedures Section (1941). Manual for the General Classification Tests, Forms 1c and 1d. National Library of Medicine digital collections: standard score scale, p. 1.
- Hauser, R. M. (2002). Meritocracy, cognitive ability, and the sources of occupational success. CDE Working Paper 98-07, Center for Demography and Ecology, University of Wisconsin-Madison: pp. 28 to 30, 35 to 38, Table 1 and Figures 7 to 12.
- Gottfredson, L. S. (1997). Why g matters: The complexity of everyday life. Intelligence, 24(1), 79 to 132: p. 87 and Figure 1, summarising the 1992 Wonderlic user's manual.
- Adams, R., Keloharju, M. and Knüpfer, S. (2018). Are CEOs born leaders? Lessons from traits of a million individuals. Journal of Financial Economics, 130(2), 392 to 408: Table 1, p. 397, and p. 399.
- Dal Bó, E., Finan, F., Folke, O., Persson, T. and Rickne, J. (2017). Who becomes a politician? Quarterly Journal of Economics, 132(4), 1877 to 1914. Figures from NBER Working Paper 23120, Tables 1 and 2, pp. 37 to 38.
- Schmidt, F. L. and Hunter, J. E. (1998). The validity and utility of selection methods in personnel psychology. Psychological Bulletin, 124(2), 262 to 274.
- Sackett, P. R., Zhang, C., Berry, C. M. and Lievens, F. (2022). Revisiting meta-analytic estimates of validity in personnel selection. Journal of Applied Psychology, 107(11), 2040 to 2068.
- Strenze, T. (2007). Intelligence and socioeconomic success: A meta-analytic review of longitudinal research. Intelligence, 35(5), 401 to 426.
- Keuschnigg, M., van de Rijt, A. and Bol, T. (2023). The plateauing of cognitive ability among top earners. European Sociological Review.
- Zagorsky, J. L. (2007). Do you have to be smart to be rich? The impact of IQ on wealth, income and financial distress. Intelligence, 35(5), 489 to 501.
- Antonakis, J., House, R. J. and Simonton, D. K. (2017). Can super smart leaders suffer from too much of a good thing? The curvilinear effect of intelligence on perceived leadership behavior. Journal of Applied Psychology, 102(7), 1003 to 1021.
Where does your own reasoning sit?
Job averages describe groups. To see your own score, try the free Assessivo IQ test: 36 timed questions, your result straight away, no sign-up.
Take the free IQ test