In short: there is no official SAT to IQ conversion, because the SAT is not designed as an IQ test. The two are closely related, though: research finds SAT scores correlate at around 0.8 with general intelligence. A fair rough estimate takes your SAT percentile among all US 11th and 12th graders, finds the IQ at the same percentile, then pulls it a little towards 100. On that method a 1200 SAT points to an IQ of about 111, a 1400 to about 123 and a 1600 to about 131, each give or take around 9 points, and sometimes much more.
SAT to IQ estimator
SAT to IQ: the short answer
An SAT score and an IQ score answer different questions. The SAT asks how well a student handles the reading, writing and maths taught in American high schools, under timed conditions. An IQ test asks how someone's reasoning compares with a representative sample of people their age. Because both lean heavily on the same general reasoning ability, people who do well on one tend to do well on the other. That overlap is strong enough to support an estimate, and loose enough that the estimate should never be treated as your IQ.
So the honest answer to "what is my IQ from my SAT?" is a range, not a number, and the estimator above gives that range for the current SAT.
How the SAT to IQ estimate works
Online SAT to IQ calculators often disagree because they use different formulas built on different versions of the test. Ours uses a simple method you can check by hand, with every input taken from a published source.
- Find your percentile. College Board publishes a nationally representative percentile for every total score from 400 to 1600. It comes from a research study of US students in 11th and 12th grade, weighted "to represent all U.S. students in those grades, regardless of whether they typically take the SAT". That makes it the closest thing to a general-population ranking, which is what IQ scales are built on.
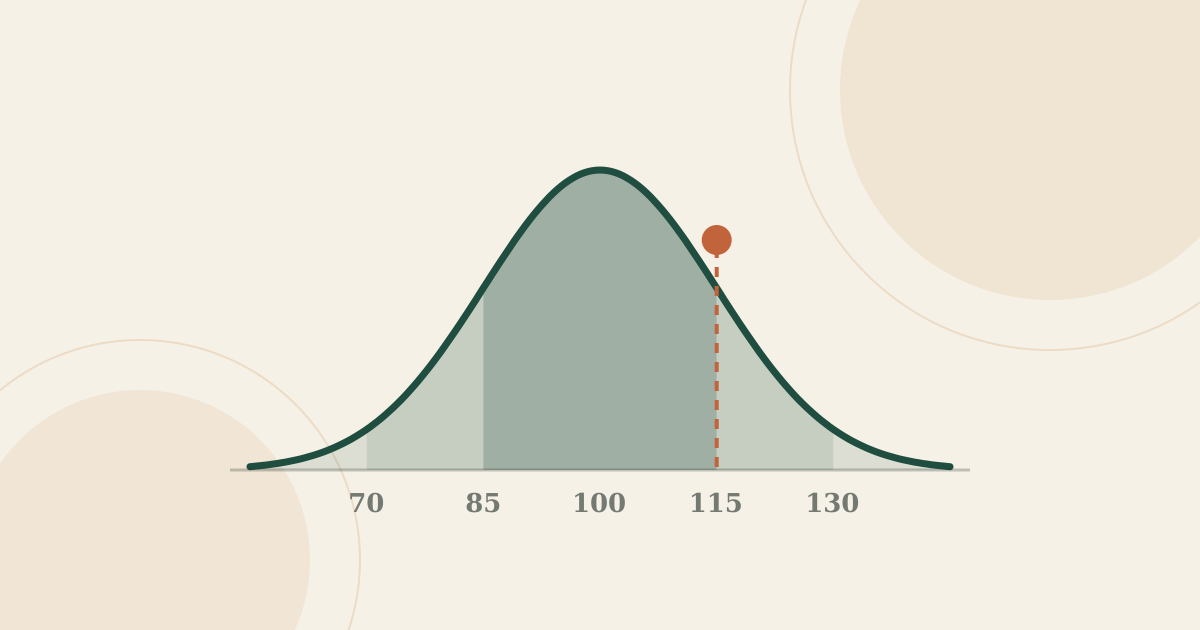
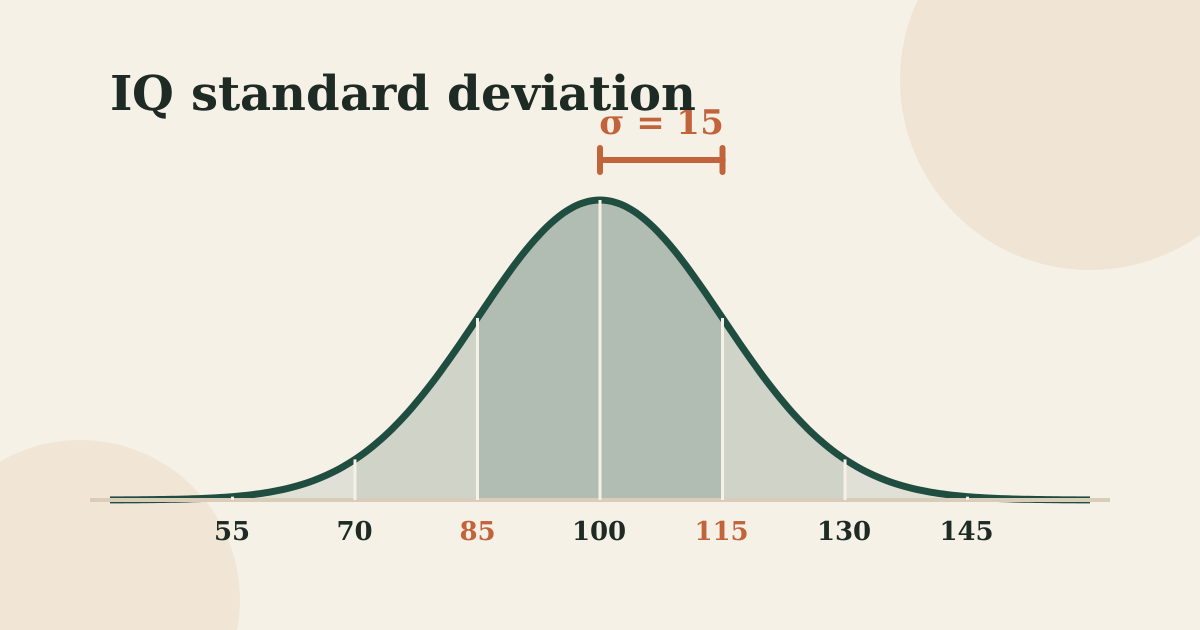
- Find the IQ at the same percentile. IQ scales are normed so that 100 is average and each standard deviation is worth 15 points. A score at the 97th percentile, for example, sits about 1.88 standard deviations above the middle, which on an IQ scale is about 128. Our IQ percentile calculator does the same conversion in either direction.
- Pull the figure towards 100. If the two tests were identical, step 2 would be the answer. They are not. With a correlation of about 0.8, a person's IQ is expected to sit only 80% as far from the average as their SAT score does. So 128 becomes 100 + 0.8 × 28.2, or about 123. This is the same regression to the mean that makes very tall parents tend to have slightly less tall children.
- Add the margin of error. A correlation of 0.8 still leaves a spread of about 9 IQ points either way for two people in three, and about 18 points either way for 95 in 100. A 1400 SAT therefore fits an IQ anywhere from roughly 114 to 132 in most cases, and occasionally outside that.
Why we don't shrink by more, or less. Published correlations between the SAT and intelligence measures run from about 0.4 to about 0.9, depending on who was tested and which test was used (see below). We use 0.8 because it is close to the results from large, broad samples. The lower figures tend to come from groups of students with a narrow spread of scores, such as Frey and Detterman's own .48 at a selective university. A lower correlation would pull every estimate closer to 100 and widen the range.
SAT to IQ conversion chart
The chart shows, for each SAT total score, the IQ at the same national percentile and the estimate after allowing for the imperfect correlation, with the typical range shaded around it.
| SAT | National percentile | Same-percentile IQ | Estimated IQ | Typical range |
|---|---|---|---|---|
| 1600 | 99+ | 139 | 131 | 122 to 140 |
| 1550 | 99+ | 139 | 131 | 122 to 140 |
| 1500 | 99th | 135 | 128 | 119 to 137 |
| 1450 | 99th | 135 | 128 | 119 to 137 |
| 1400 | 97th | 128 | 123 | 114 to 132 |
| 1350 | 94th | 123 | 119 | 110 to 128 |
| 1300 | 91st | 120 | 116 | 107 to 125 |
| 1250 | 86th | 116 | 113 | 104 to 122 |
| 1200 | 81st | 113 | 111 | 102 to 120 |
| 1150 | 74th | 110 | 108 | 99 to 117 |
| 1100 | 67th | 107 | 105 | 96 to 114 |
| 1050 | 58th | 103 | 102 | 93 to 111 |
| 1000 | 48th | 99 | 99 | 90 to 108 |
| 950 | 38th | 95 | 96 | 87 to 105 |
| 900 | 29th | 92 | 93 | 84 to 102 |
| 850 | 21st | 88 | 90 | 81 to 99 |
| 800 | 14th | 84 | 87 | 78 to 96 |
| 750 | 8th | 79 | 83 | 74 to 92 |
| 700 | 4th | 74 | 79 | 70 to 88 |
| 650 | 1st | 65 | 72 | 63 to 81 |
| 600 | below 1st | 61 | 69 | 60 to 78 |
| 550 | below 1st | 61 | 69 | 60 to 78 |
| 500 | below 1st | 61 | 69 | 60 to 78 |
| 450 | below 1st | 61 | 69 | 60 to 78 |
| 400 | below 1st | 61 | 69 | 60 to 78 |
Percentiles: College Board, nationally representative sample of US 11th and 12th graders, current SAT. "99+" is treated as 99.5 and "1-" as 0.5, so estimates at the very top and bottom are capped. Estimated IQ = 100 + 0.8 × (same-percentile IQ − 100); typical range ± 9 points.
Three things stand out. First, the middle of the SAT scale maps to the middle of the IQ scale: a score near 1010 sits around the 50th national percentile, which corresponds to an IQ of about 100. Second, the two lines spread apart as scores get more extreme, because the shrinking step matters most where the percentile is highest or lowest. Third, the line goes flat at the top. College Board rounds its percentiles, reporting every score from 1450 to 1510 as the 99th percentile and everything from 1520 to 1600 as "99+". The chart treats "99+" as 99.5, so a 1520 and a 1600 produce the same estimate. That is a limit of the published table, not a sign that ability stops at 1520.
A perfect score also shows only that someone reached the top of the test, not how far beyond it their ability goes. Our article on Bill Gates' IQ looks at the ceiling problem through a real 1590.
How closely do SAT scores and IQ correlate?
The best-known evidence is a 2004 study by Meredith Frey and Douglas Detterman, which we summarise on our IQ 121 page: across 917 people in a US national survey, SAT scores correlated .82 with general intelligence (g) drawn from a military aptitude battery. In a second group of 104 students, the SAT correlated .48 with Raven's Advanced Progressive Matrices, or .72 once the narrow range of ability at a selective university was allowed for.
Later studies vary more than headline figures suggest. Looking back 15 years on, Frey wrote that other researchers had found correlations between the SAT and intelligence "of roughly 0.5 to 0.9, depending upon sample and the way in which intelligence is defined" (Frey, 2019). A 2006 validation study using the Reynolds Intellectual Assessment Scales found a correlation of 0.43, according to a 2016 study in Intelligence that reviewed this work. Figures from students at a single college tend to be lower, partly because such groups cover a narrower range of ability than the population as a whole.
The published conversion equations
Frey and Detterman also published two regression formulas for turning an SAT score into an estimated IQ. They are worth knowing because many online converters still use them, often without saying so.
- Equation 1, for SATs taken before the 1995 recentring: estimated IQ = (0.126 × SAT) + (−4.71E−5 × SAT²) + 40.063, with a standard error of prediction of 5.94 points. Because of the squared term the curve tops out at about 124 near an SAT of 1340 and then falls, giving a 1600 an estimate of about 121. It was built on people whose average SAT was 854, so it says little about high scorers.
- Equation 2, for recentred scores: estimated IQ = (0.095 × SAT maths) + (−0.003 × SAT verbal) + 50.241, with a standard error of 9.76. It was built on 104 students at one private university whose average SAT was 1372, and the authors themselves warned that it "must be used with caution". A perfect 800 and 800 gives about 124.
Neither equation was designed for the SAT as it has existed since 2016, which is one reason we work from current percentiles instead.
Is the SAT an IQ test?
Not by design, though it behaves a lot like one. College Board describes the SAT as measuring "the knowledge and skills students are learning in high school and that matter most for college and career readiness", and its launch announcement for the digital test makes no mention of intelligence. When Frey checked in 2019, she found no references to intelligence in College Board's test specifications, technical manual or score guide for the redesigned SAT.
The history points the other way. Carl Brigham, who had worked on the US Army's intelligence tests during the First World War, built his own version of the Army test, and a College Board committee he led turned it into the SAT. It was first given to high school students in 1926, according to PBS Frontline's history of the test. The letters once stood for Scholastic Aptitude Test, and Frey argues that the test can trace its roots through the Army tests back to Binet's original intelligence test.
The fairest summary is that the SAT is a reasoning-heavy achievement test. It loads strongly on general intelligence, the same factor IQ tests aim at, but it also rewards things IQ tests try to keep out: vocabulary and reading built up through school, taught maths, familiarity with the format and practice. Two people with the same IQ can score quite differently on the SAT if one had stronger schooling or more preparation. If you are curious which parts of thinking each test leans on, our guide to fluid and crystallized intelligence explains the difference, and the verbal reasoning page covers how word skills relate to IQ.
Old SAT vs new SAT scores
An SAT score only means something against the population it was scaled on, and that has changed several times.
- 1926 to early 1995: the original scale. Section scores were set to average 500 in 1941, then drifted down. By 1994 the average verbal score had fallen to about 420 and the average maths score to about 478 (The Dartmouth, 1995).
- April 1995: recentring. College Board reset the scale so that mean scores sat "at or near the midpoint of 500" again (College Board). The same raw performance began to earn a higher score, and perfect 1600s became more common. A 1300 from 1990 therefore ranks higher than a 1300 from 2000.
- March 2016: the redesigned SAT. The test returned to the 1600 scale, with Evidence-Based Reading and Writing and Math sections of 200 to 800 each. It debuted on 5 March 2016.
- 2023 to 2024: the digital SAT. The test went digital internationally in March 2023 and across the United States from March 2024. It lasts "just over 2 hours compared to 3 hours" for the paper version and uses multistage adaptive testing: each section has two modules, and the second becomes harder or easier depending on how the first went.
The estimator uses current percentiles, so it fits scores from the digital SAT best and scores from 2016 onwards reasonably. For a pre-1995 score it will understate where you stood, and for 1995 to 2015 the fit is only approximate. Our article on Elon Musk's IQ shows how much an old-scale score can shift once these changes are taken into account.
Why SAT takers aren't everyone
SAT takers are a large group but not a random one. In the high school class of 2026, 1,954,833 students took the SAT, with an average total score of 1045 (College Board, 2026). Some states give it to all 11th graders as their official assessment: College Board lists nine, from Colorado to West Virginia. Elsewhere, taking it is a choice, and students planning to go to selective colleges are more likely to make it.
That selection is why College Board publishes two sets of percentiles. The "user" percentiles compare you with recent test takers; the nationally representative ones compare you with all students in those grades. At the top they differ noticeably: a 1400 is at the 93rd percentile of users but the 97th of all students, and a 1200 at the 75th and 81st. Using the user figure would understate an estimate in this range, which is why the estimator relies on the nationally representative one.
Even the national figure covers only American teenagers in their last two years of school, not adults or people elsewhere, so treat estimates for anyone schooled in another language or system with extra caution.
What about the ACT?
The ACT, the other big US college entrance exam, shows a similar link. Using the same national survey as the SAT study, Koenig, Frey and Detterman (2008) found a correlation of 0.77 between ACT scores and general intelligence for 1,075 people. In a more recent sample of 149, Composite ACT scores correlated 0.61 with IQ scores derived from Raven's matrices. The authors concluded that ACT scores "can be used to accurately predict IQ in the general population". The same caution applies as with the SAT: the data came from earlier versions of the test, and even a strong correlation leaves plenty of room for individual error. We do not run ACT scores through our estimator because we have not verified a current nationally representative ACT percentile table to anchor it.
Can you use an SAT score for Mensa?
Only an old one. American Mensa's list of qualifying test scores accepts:
- an SAT score of 1300 if the test was taken before 30 September 1974
- an SAT score of 1250 if it was taken from 30 September 1974 to 31 January 1994
- no SAT score taken after 31 January 1994
The ACT is treated the same way: a composite of 29 qualifies if taken before September 1989, and later ACT scores are not accepted. So a modern SAT, however high, will not get you into Mensa. To join, Mensa normally asks for a result in the top 2 percent of the general population on an accepted intelligence test, which on most IQ scales is a score of about 130. On our method, even a perfect 1600 gives a central estimate only just above that, with a wide range either side.
What this means for you
If you have an SAT score, it is a reasonable first clue to where your reasoning sits, not a verdict. A few points help keep it in proportion:
- Read the range, not the midpoint. An estimate of 118 really means "probably somewhere between about 109 and 127".
- Remember what else went into the score. Teaching, sleep, nerves, preparation and how many times you sat the test all move an SAT score without changing underlying ability.
- Check the version. Scores from before 1995 or before 2016 sit on different scales, so the estimate will be rougher.
- Test the thing itself. If you want an IQ score, take an IQ test. You can try our free IQ test (36 timed questions across four areas of reasoning), and our guide to what IQ means explains how to read the result.
Frequently asked questions
What IQ is a 1400 SAT?
As a rough estimate, about 123. College Board puts a 1400 at the 97th percentile of all US 11th and 12th graders, which matches an IQ of about 128. Allowing for the imperfect link between the two tests brings that to about 123, with a typical range of roughly 114 to 132. A 1440, at the 98th percentile, works out at about 125.
What IQ is a 1500 SAT?
Roughly 128, as an estimate rather than a measurement. A 1500 sits at the 99th national percentile, the same rank as an IQ of about 135. Because SAT and IQ scores correlate at around 0.8 rather than perfectly, the expected IQ is pulled towards the average, giving about 128 with a typical range of around 119 to 137.
What IQ is a 1600 SAT?
About 131 on our method, with a typical range of roughly 122 to 140. College Board reports every score from 1520 to 1600 as the "99+" percentile, which we treat as 99.5. A perfect score is also a ceiling: it shows someone reached the top of the test, not how far their ability goes beyond it, so claims of a 160 IQ from a 1600 SAT do not hold up.
What IQ is a 1200 SAT?
About 111. A 1200 is at the 81st percentile of all US students in 11th and 12th grade, which corresponds to an IQ of about 113 at the same rank. Pulling that towards the average to allow for the imperfect correlation gives about 111, with a typical range of about 102 to 120. That is a rough estimate, not an IQ score.
Is the SAT an IQ test?
Not officially. College Board describes it as a test of the knowledge and skills taught in high school, and it rewards schooling, vocabulary and practice. But it began as an adaptation of US Army intelligence tests, and research finds SAT scores correlate at around 0.8 with general intelligence in broad samples. It is best described as a reasoning-heavy achievement test that overlaps strongly with IQ.
How accurate is SAT to IQ conversion?
Only roughly. Even with a correlation of 0.8, a converted score is typically off by up to about 9 IQ points, and in about 1 case in 20 by more than 18. Estimates are rougher still for scores from before the 1995 recentring or the 2016 redesign, for very high scores near the ceiling, and for people who took the test after heavy preparation or in a second language.
What SAT score matches an IQ of 130?
Around 1350 on the current SAT, as a rough guide. Going from IQ to SAT also involves pulling towards the average: an IQ of 130 is 2 standard deviations above the mean, so the expected SAT sits about 1.6 above it, near the 94th national percentile. An IQ of 115 points to roughly 1180 to 1190. Individual scores vary widely around these figures.
Does Mensa accept SAT scores?
Only older ones. American Mensa accepts an SAT of 1300 taken before 30 September 1974, or 1250 taken from then until 31 January 1994. SAT scores from after January 1994 are not accepted, however high. For a modern score, the route into Mensa is an approved intelligence test, where it asks for a result in the top 2 percent of the general population.
Can you convert an ACT score to IQ?
Roughly, in the same way as the SAT. A 2008 study found ACT scores correlated 0.77 with general intelligence in a national sample of 1,075 people, and 0.61 with Raven's matrices in a smaller group. We do not offer an ACT estimate because we have not verified a current nationally representative ACT percentile table. American Mensa accepts an ACT composite of 29 only if taken before September 1989.
Do old SAT scores convert differently?
Yes. Before April 1995, averages had drifted to about 420 verbal and 478 maths, so the same score ranked higher than it would today. College Board then recentred the scale, and in 2016 it redesigned the test again. Our estimator uses current percentiles, so it will tend to understate where a pre-1995 score really stood, and is only approximate for scores from 1995 to 2015.
Sources
- College Board. SAT Nationally Representative and User Percentiles. College Board Research (accessed October 2026): percentile ranks for total scores used in the estimator and chart.
- College Board (2026). 2026 SAT Suite of Assessments Annual Report: Total Group: number of test takers, mean scores and SAT School Day states for the class of 2026.
- College Board (2026). Understanding Scores, SAT Weekend, Fall 2026: score ranges, percentiles on score reports and multistage adaptive testing.
- College Board (2024). Digital SAT launches across the country, completing the transition to digital. College Board Newsroom.
- College Board (2016). Final administration of the previous SAT on Jan. 23; redesigned SAT to debut on March 5, 2016. College Board Newsroom.
- College Board (2014). The College Board announces bold plans to expand access to opportunity; redesign of the SAT. College Board Newsroom: return to the 1600 scale.
- College Board. Table 2: Average SAT scores of entering college classes, 1967–2003: note on the April 1995 recentring.
- Frey, M. C. and Detterman, D. K. (2004). Scholastic Assessment or g? The relationship between the Scholastic Assessment Test and general cognitive ability. Psychological Science, 15(6), 373–378.
- Frey, M. C. (2019). What we know, are still getting wrong, and have yet to learn about the relationships among the SAT, intelligence and achievement. Journal of Intelligence, 7(4), 26.
- Beaujean, A. A., Firmin, M. W., Knoop, A. J., Michonski, J. D., Berry, T. P. and Lowrie, R. E. (2006). Validation of the Frey and Detterman (2004) IQ prediction equations using the Reynolds Intellectual Assessment Scales. Personality and Individual Differences, 41(2), 353–357.
- Hannon, B. (2016). General and non-general intelligence factors simultaneously influence SAT, SAT-V, and SAT-M performance. Intelligence, 59, 51–63.
- Koenig, K. A., Frey, M. C. and Detterman, D. K. (2008). ACT and general cognitive ability. Intelligence, 36(2), 153–160. Abstract via ERIC.
- American Mensa. Qualifying test scores: SAT and ACT cut-offs by test date. See also About American Mensa for the top 2 percent requirement.
- FRONTLINE, PBS. Secrets of the SAT: history of the SAT, a timeline: Carl Brigham, the Army tests and the first SAT in 1926.
- The Dartmouth (1995). SAT recentering 'defines down' success: average scores before the 1995 change.
Want an IQ score, not an estimate?
An SAT score can only hint at your IQ. The free Assessivo IQ test measures reasoning directly: 36 timed questions, then your result straight away, with no sign-up.
Take the free IQ test