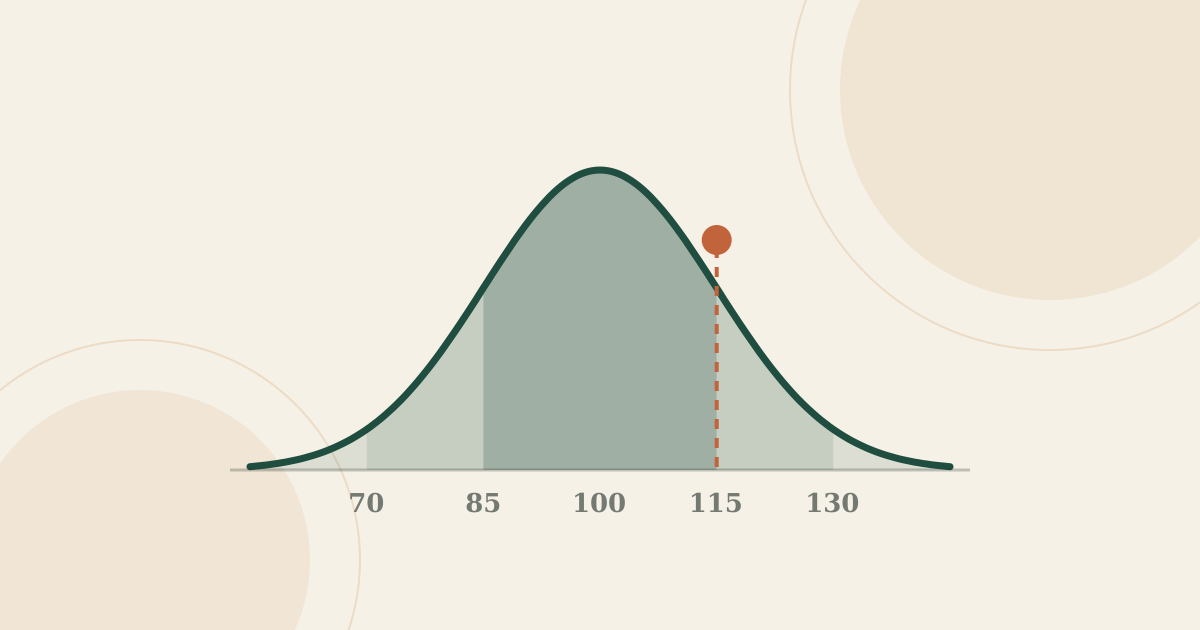
In short: the standard deviation of IQ is 15 points on most modern tests. It measures how spread out scores are around the average of 100: one standard deviation above average is 115, two is 130, three is 145. Some older or specialist tests use 16 or 24 instead, so the same performance can produce different numbers, and scores should only be compared on the same scale.
What is a standard deviation?
A standard deviation is a measure of spread: roughly, how far a typical score sits from the average. If everyone in a group scored close to the average, the standard deviation would be small. If scores were spread widely, it would be large.
Two groups can have exactly the same average and still look very different. Both groups below average 100, but their scores are spread out very differently:
An average alone hides this. That is why an IQ score is always defined by two numbers: the average, set at 100, and the standard deviation, set at 15. Together they tell you exactly how unusual any score is.
How the standard deviation is calculated
The calculation is simpler than it sounds. Using Group B from above:
- Find the average. 70 + 85 + 100 + 115 + 130 = 500, and 500 ÷ 5 = 100.
- Find each score's distance from the average and square it, which removes minus signs and gives more weight to scores far from the middle.
- Average the squared distances. This is called the variance.
- Take the square root to get back to the original units, IQ points.
| Score | Distance from 100 | Squared |
|---|---|---|
| 70 | -30 | 900 |
| 85 | -15 | 225 |
| 100 | 0 | 0 |
| 115 | +15 | 225 |
| 130 | +30 | 900 |
| Average of squared distances | 2,250 ÷ 5 = 450 | |
| Standard deviation | √450 ≈ 21.2 | |
When the group is only a sample from a larger population, statisticians divide by one less than the number of scores (here 4 instead of 5), which gives a slightly larger answer. Test publishers work with samples of thousands, where the difference is negligible.
IQ test makers do this on a large, carefully chosen sample of people of each age. They then rescale the results so that the sample's average becomes 100 and its standard deviation becomes 15. Your score is placed on that same scale, which is why it describes your position relative to other people rather than a count of right answers.
Why the IQ standard deviation is 15
There is nothing natural about 15. It is a convention. The earliest IQ tests divided a child's "mental age" by their real age, and the spread of scores varied from age to age. For his new adult test of 1939, David Wechsler took a different approach, the deviation IQ: compare each person with others their own age, then place them on a scale with an average of 100 and a fixed standard deviation, which he set at 15.
The approach caught on. The Stanford-Binet moved towards deviation IQs from 1960, though with a standard deviation of 16, and kept 16 until its fifth edition in 2003 switched to 15. Today almost every major test uses 15, which is why it is treated as the standard. Our guide to the Wechsler IQ test (WAIS) covers how the modern version is scored, and What is IQ? explains what the scale measures.
IQ scores by standard deviation
Because IQ scores follow a bell curve, each standard deviation from the average marks a predictable share of people. On the standard scale:
| Standard deviations | IQ score | Higher than | Rarity at or above |
|---|---|---|---|
| −3 | 55 | about 0.1% of people | – |
| −2 | 70 | about 2% of people | – |
| −1 | 85 | about 16% of people | – |
| +1 | 115 | about 84% of people | 1 in 6 |
| +2 | 130 | about 98% of people | 1 in 44 |
| +3 | 145 | about 99.9% of people | 1 in 741 |
| +4 | 160 | about 99.997% of people | 1 in 31,574 |
Between those marks, about 68% of people score within one standard deviation of the average (85 to 115), about 95% within two (70 to 130) and about 99.7% within three (55 to 145). Our IQ scale and score ranges page shows the labels used for each band, and our page on the highest IQ in the world follows the curve out to its extremes.
Standard deviations of 15, 16 and 24
Not every test uses 15. The three you are most likely to meet:
This matters most at the top. Mensa, which admits the top 2%, lists a qualifying score of 130 on the Wechsler scales, 132 on older Stanford-Binet editions and 148 on the Cattell. All three describe exactly the same level. A 148 on one test is not a higher result than a 130 on another.
The same effect explains some impressive-looking scores online. A test that reports on a standard deviation of 24, or doesn't say which it uses, can produce numbers that sound exceptional but are ordinary on the standard scale.
IQ scale converter
Enter a score and the standard deviation it was reported on, and see the same result on the other scales. For percentiles, rarity and the score you need for any percentile, use the IQ percentile calculator.
Convert an IQ score between scales
All scales here use an average of 100. Conversion keeps the same percentile.
That is 2 standard deviations above average, at about the 98th percentile.
Z-scores and percentiles
The converter works through a z-score, the number of standard deviations a score is from the average:
z = (IQ − 100) ÷ standard deviation
For example, an IQ of 124 on the standard scale: (124 − 100) ÷ 15 = 1.6 standard deviations above average.
A z-score can be turned into a percentile using the bell curve: a z of 1.6 is higher than about 95% of people. To convert between scales, keep the z-score and multiply by the other scale's standard deviation: 1.6 × 24 + 100 = 138 on the Cattell scale. Professional tests use the same logic inside: subtest results are often reported on a 1-to-19 scale centred on 10, with 3 points to each standard deviation, then combined onto the IQ scale.
What a difference in IQ points means
Standard deviation is also the best way to judge whether a gap between two scores matters. Because 15 points is one standard deviation:
- 5 points is a third of a standard deviation. Two people 5 points apart may well swap places on another day, because that is about the size of a professional test's own margin of error.
- 10 points is two thirds of a standard deviation, a noticeable difference. Moving from 100 to 110 means going from the middle of the population to ahead of about three in four people.
- 15 points is a full standard deviation. From 100 to 115 moves you from the 50th to about the 84th percentile, but from 130 to 145 moves you from about the 98th to the 99.9th: the same gap in points, a very different change in rarity.
The last point is the key one. Near the average, a few points shift your percentile a lot. Far from the average, each extra point is rarer still, but the percentile barely moves. That is why percentiles and IQ points can feel like they tell different stories about the same score.
Is IQ really a perfect bell curve?
Approximately, and partly by design. Scores on broad tests of reasoning do tend to form a bell shape, but test makers also convert raw scores in a way that fits them to the bell curve's proportions when they build the norms. So the neat percentages in this article describe the scale that tests use, more than a law of nature.
The fit is weakest at the extremes. Very few people are tested at the far ends, so whether exactly 1 person in 31,574 really scores 160 or above is impossible to confirm. Conditions that affect development can also add more very low scores than a perfect curve predicts. For everyday scores between about 70 and 130, the standard deviation and the bell curve together give a reliable guide to how common a score is.
Standard deviation vs standard error of measurement
Two terms with similar names cause a lot of confusion:
The standard error is worked out from the standard deviation and the test's reliability: standard deviation × √(1 − reliability). A full professional IQ score with a reliability of about 0.98 has a standard error of about 15 × √0.02 ≈ 2.1 points, so a 95% confidence interval runs about 4 points either side of the score. Shorter or less reliable tests have larger errors. Our article on how accurate online IQ tests are explains why a single score is best read as a range.
Frequently asked questions
What is the standard deviation of IQ?
On most modern IQ tests, including the Wechsler scales and the current Stanford-Binet, the standard deviation is 15 points. With the average fixed at 100, 115 sits one standard deviation above the mean and 85 one below.
Is the IQ standard deviation 15 or 16?
Both have been used. The Wechsler tests have always used 15. Older editions of the Stanford-Binet used 16 until the fifth edition in 2003, which switched to 15. Some tests, such as the Cattell, use 24.
How many standard deviations is an IQ of 130?
Two. With an average of 100 and a standard deviation of 15, 130 is 30 points, or two standard deviations, above average, a level only about 2% of people reach.
What IQ is 3 standard deviations above the mean?
An IQ of 145 on a test with a standard deviation of 15. Only about 1 person in 741 scores that high or higher.
Why do some online tests give such high IQ scores?
Some use a standard deviation of 24, the Cattell scale, which spreads the same results over a wider range of numbers. A score of 148 on that scale is the same rarity as 130 on a standard test. Always check which scale a score uses.
What is the difference between standard deviation and the standard error of measurement?
The standard deviation describes how spread out everyone's scores are. The standard error of measurement describes how precise one person's score is. On a reliable professional test it is around 2 to 3 points, which is why reports give a range around a score.
Sources
- Qualifying test scores, American Mensa: qualifying scores on the Wechsler, Stanford-Binet and Cattell scales.
- Stanford–Binet Intelligence Scales, Wikipedia: the 1960 deviation IQ and the fifth edition's switch to a standard deviation of 15.
- IQ classification, Wikipedia: Wechsler's 1939 deviation IQ.
- Intelligence test, Encyclopaedia Britannica: ratio and deviation IQ.
- Review of the WAIS-IV, Canivez (2010), Mental Measurements Yearbook: reliability of full scale IQ scores.
- Wechsler Adult Intelligence Scale, Fifth Edition, Pearson.
See your score on the standard scale
The free Assessivo IQ test reports on the standard scale, an average of 100 and a standard deviation of 15, with your percentile alongside.
Take the free IQ test